|
9/11/2016 0 Comments Height of Flag1) A. This graph would mean that in every x amount of seconds the flag would go up up the same height considering the positive slope of the graph B. This graph shows that as time goes by the height of the flag increases and after a certain point the height starts to decrease ;its exponential C.This third wave line shows repetitiveness which means that the flag with time in a repetitive manner goes up and then comes down a little then up again like the sin graphs D.This is a exponential graph that keeps increasing so the flag with time would just keep going up as time passes. E.This graph is very similar to the c its the same kind except the waves are longer. F. This graph say that the flag would be all the heights at the same time which is impossible and makes no sense. 2) According to me graph D has the most realistic demonstration because it means that the flag would keep going up with time so as the little boy lifts the flag the time passes and the flags height increases. 3) Graph F makes no sense and would be the most unrealistic because the flag can't be at all those different heights at the same time. 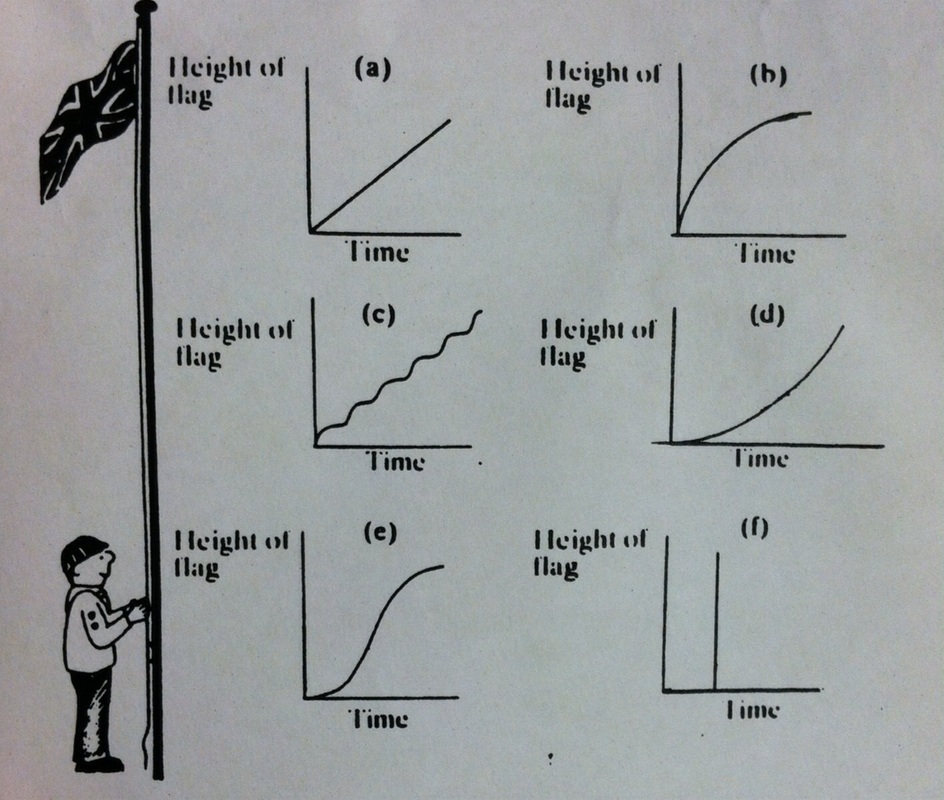
0 Comments
Leave a Reply. |
Sana Gala
Average Pre-Calc student Doing a miserable job |
 RSS Feed
