|
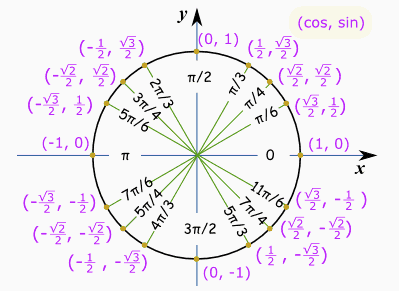
2/28/2017 0 Comments Feeling TrigIn this activity I learned a lot about sine cosine and tangent waves and it gave a better visual and understanding to the concept. Some big giveaways was I got a much better understanding of radian relation to the waves. I found this activity really helpful and it helped me grasp the concept.
0 Comments
 12/8/2016 0 Comments Radian Blog Post
 11/18/2016 0 Comments LINK TO MY PROOFhttps://docs.google.com/a/mp.edzone.net/presentation/d/1aAY-q3sFSefDqOk6xCO5N_GwSnz-iq6ANIYahhaKakE/edit?usp=sharing
10/26/2016 0 Comments Bring It All Together1.Connection between factors and zeros?
The factors when put as equal to zero gives you the zeroes of the equation. 2. How does division help us to factor polynomials? You can use synthetic division to find the factor forms of the polynomials. 3. How does the degree of the polynomial help us to predict the number of zeroes? The highest degree of the polynomial is the number of zeros that polynomial has.There might be repeating numbers which might change the amount of zeroes. ex.if a polynomials highest degree is 5 you can predict it has 5 zeroes. 4. Does that always tell us the number of factors? Yes 9/28/2016 0 Comments Domain and Range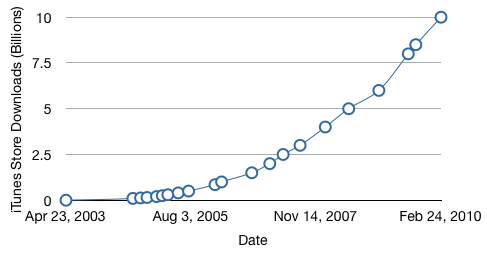 The type of function this data appears to follow is an exponential data. Addition to blog post: The graph is a classic example of exponential growth, but it has a human element involved after 2013. Please read the following article and comment on the future shape of your mathematical model: 1) According to the graph following the trend the store downloads would just keep increasing but after reading the post and finding out how at 2013 the human involvement would affect the graphs trend. How does this affect your predictions of domain and range of the function? Is there a problem with trying to extend a set of data points to continuous functions? Why or why not? What does this tell us about making predictions based on trends? Why or why not? 2) It changes the predictions because you know theres another effector to the trend There is a problem with trying to extend it because the human involvement is random you can expect it.Predictions based on trends is only accurate if the situation has no further involvement with game changing factors. 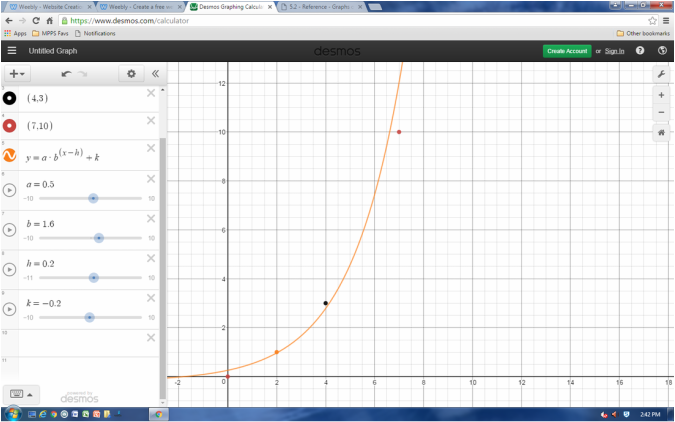 y=.5-1.6^(x-.2)-.2 ( this is the equation of my model)
The domain of this function is x>0 The range of this function is y>0 9/27/2016 0 Comments Cress and LittleBy plotting the plot and making a polyfit line to the points of the basketball i predict that the ball is going to go in the basket clear all hoop!!!!
9/11/2016 0 Comments Height of Flag1) A. This graph would mean that in every x amount of seconds the flag would go up up the same height considering the positive slope of the graph B. This graph shows that as time goes by the height of the flag increases and after a certain point the height starts to decrease ;its exponential C.This third wave line shows repetitiveness which means that the flag with time in a repetitive manner goes up and then comes down a little then up again like the sin graphs D.This is a exponential graph that keeps increasing so the flag with time would just keep going up as time passes. E.This graph is very similar to the c its the same kind except the waves are longer. F. This graph say that the flag would be all the heights at the same time which is impossible and makes no sense. 2) According to me graph D has the most realistic demonstration because it means that the flag would keep going up with time so as the little boy lifts the flag the time passes and the flags height increases. 3) Graph F makes no sense and would be the most unrealistic because the flag can't be at all those different heights at the same time. 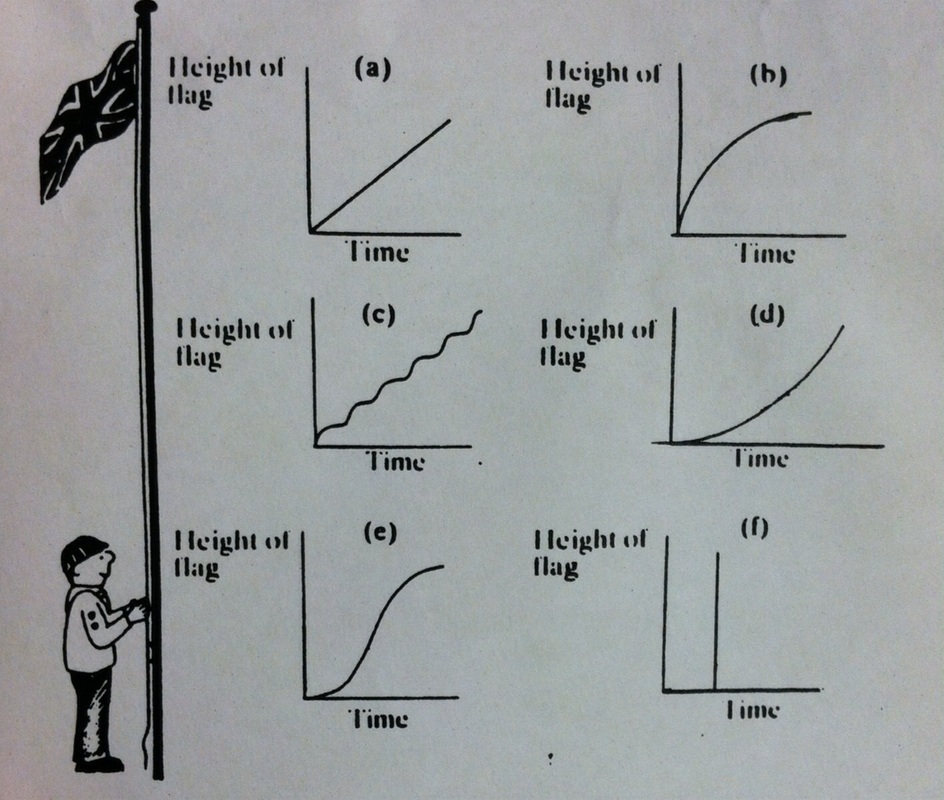 |
Sana Gala
Average Pre-Calc student Doing a miserable job |
 RSS Feed
